FORESIGHT RADAR
Future of Data Centres
In our latest report, Future of Data Centres, we followed one word through an entire industry: power. Political, electrical and economic. It decides which nations lead in AI, how far the grid can stretch and whether the capital flowing into the sector will pay off.
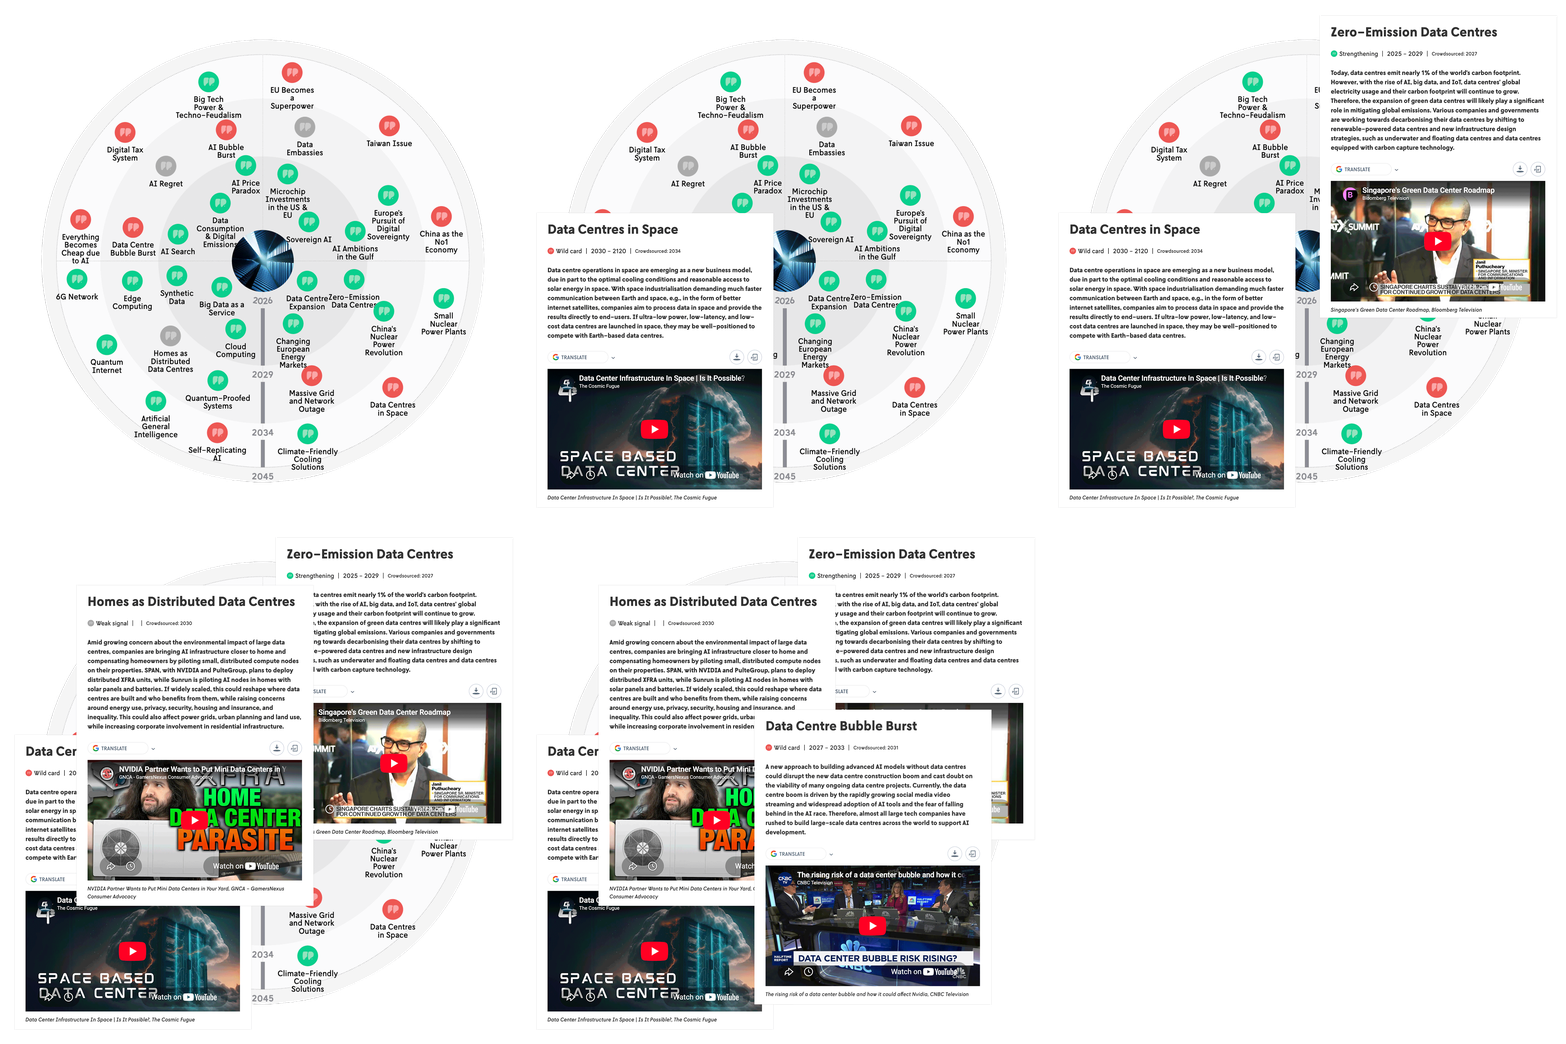
This foresight radar takes that analysis further. It adds 15 new trend analyses from our futurists and places them all on one interactive radar view, so you can see how the pieces connect.
Four lenses on the future of data centres
The new geography of compute. Where compute is built and who controls it, from data embassies to the Gulf’s AI ambitions.
Powering the machine. Energy, cooling and the physical limits of growth, from small nuclear power plants to data centres in space.
Technological frontiers. How the infrastructure itself is changing, through edge computing, 6G, synthetic data and quantum-proofed systems.
The economics of compute. Who captures the value and what happens if the bets fail, from Big Tech’s market power to the AI price paradox.
Access the foresight radar
How to use the foresight radar
The radar brings together over 30 in-depth analyses of future trends, weak signals of change, and potential wild cards, which are collectively referred to as “future phenomena.”
Radar layout & navigation
Each circle on the radar represents a future phenomenon.
Placement reflects the anticipated nature and timeline of the given phenomenon’s future impact
Click any circle to open the phenomenon card, where you’ll find a detailed analysis by our team of futurists
Drag or pinch the radar to zoom in and out
What’s included on each phenomenon card
Overview and background of the topic
Futurists’ assessments of potential future impacts across sectors
Related phenomena and recent news signals
Voting, commenting, and rating options
Select cards also include four alternative future scenarios
Collaboration features
You can vote and comment on each phenomenon directly on its card. To see overall voting results and comments, click on the centre of the radar.
How to read the phenomena colours

The phenomenon is becoming more common or acute during the given timeframe. Most of its change potential is still ahead.

The phenomenon is becoming more unusual. During the given timeframe, most of its change potential or value has already occurred.

A possible but not probable event or change. The probability within the given timeframe is between 5% to 30%.

A small emerging issue in the present. At the given timeframe, it is still hard to say whether it will become a trend.
Explore the radar alongside the report
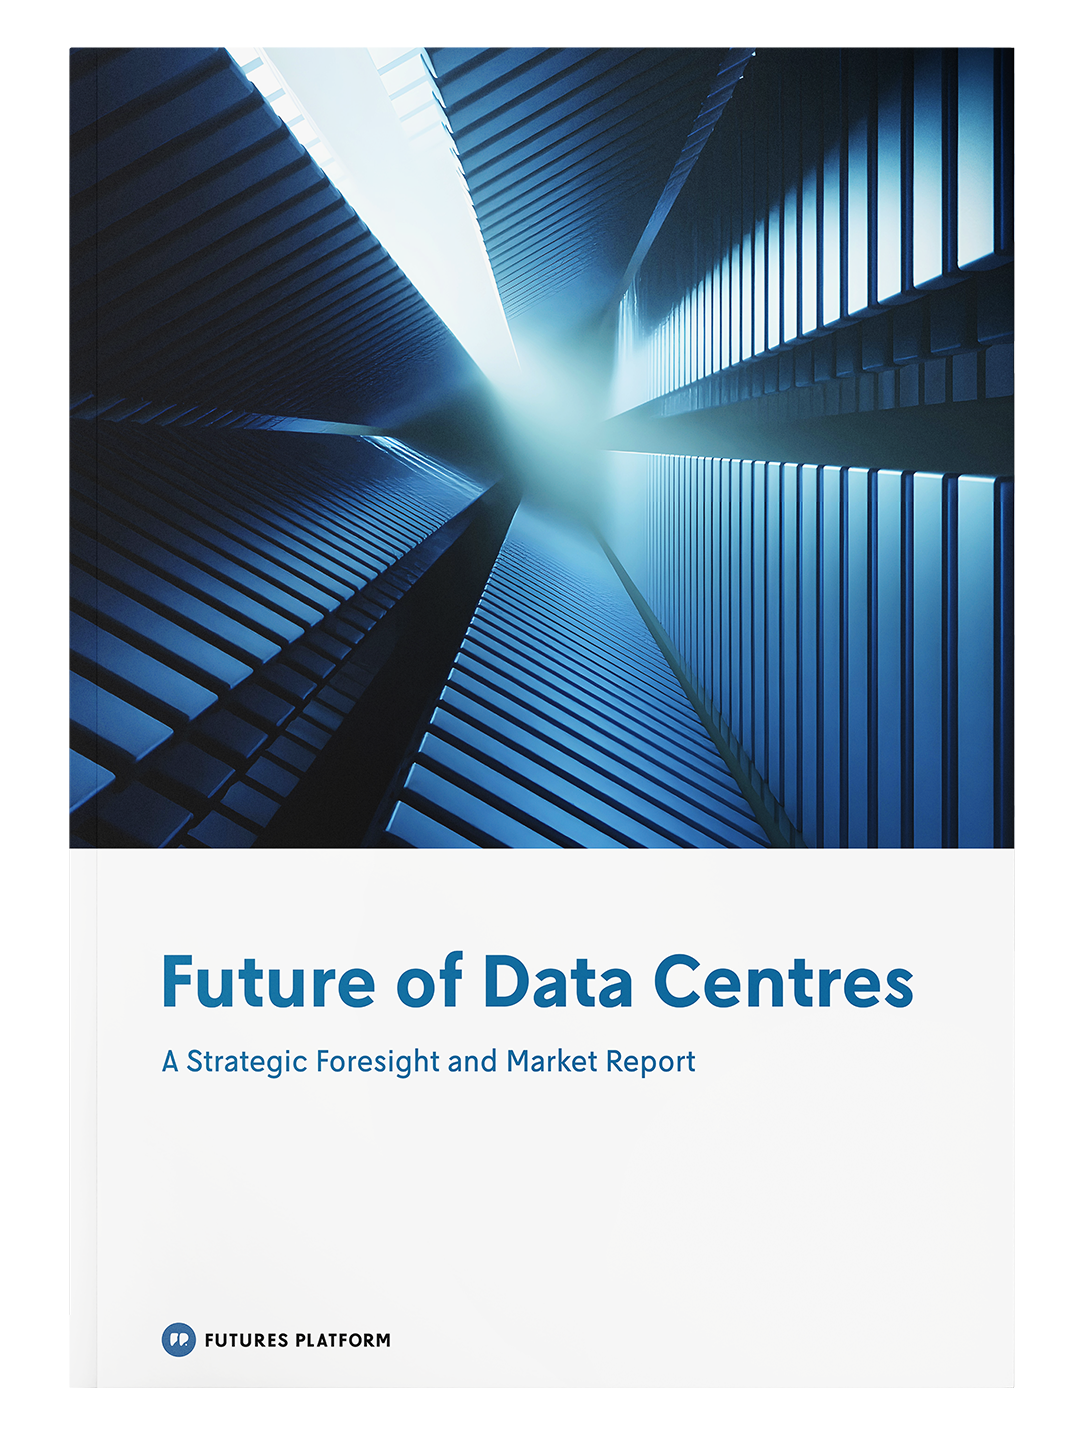
The radar works as a companion to the full Future of Data Centres report, which pairs these phenomena with market data.
Trusted by