S-Curve Analysis: Identifying when an emerging change signal becomes a viable opportunity
S-curve analysis can help pinpoint emerging change signals before they evolve into prominent trends, giving organisations a strategic view to enter the market when the timing is ripe for maximum potential.

FUTURE PROOF – BLOG BY FUTURES PLATFORM
Often, by the time people notice trends, they're already everywhere. But behind the scenes, the journey of a trend starts long before it gains traction in the market. S-curve analysis can help pinpoint emerging change signals before they evolve into prominent trends, giving organisations a strategic view to enter the market when the timing is ripe for maximum potential.
Trends and change signals are never static. Even those progressing at a snail's pace possess a time element and a trajectory. They grow, reach maturity, and then decline along their lifecycle, typically following an S-curve pattern.
The S-curve analysis can be used to identify nascent change signals that have the potential to evolve into prominent trends, as well as discern whether an established trend still has room for growth or if it's poised to lose momentum.
Subscribe to our weekly newsletter
How to place trends and emerging change signals along the S-curve
Growing trends, having journeyed a significant portion of the curve, can be tracked using historical data such as investment and market growth rates, along with indicators like Google Trends, to pinpoint where it stands on its S-curve trajectory.
In contrast, emerging change signals lack such historical data points due to their nascent nature. Positioned at the outset of the S-curve, these signals either ascend along its trajectory or plateau if they fail to reach the necessary inflection point for widespread adoption.
So, how can one discern which change signals possess the potential to mature into trends, and which ones will fail to transform into tangible market opportunities?
In theory, interconnected trends and phenomena progress along the S-curve in unison as they share the same underlying change drivers and face similar bottlenecks. For instance, the rise of electric vehicles and renewable energy are both driven by the shared underlying change driver, which is the need to reduce carbon emissions. Both also face comparable bottlenecks, such as infrastructure development and public acceptance. Hence, when a new change signal aligns with an existing cluster of trends, it offers insight into its probable behaviour and trend potential.
“Positioned at the outset of the S-curve, emerging change signals either ascend along its trajectory or plateau if they fail to reach the inflection point for widespread adoption.”
Foresight offers several methodologies to analyse these underlying change drivers and assess whether an emerging change signal will gain prominence or fade without significant impact.
One such methodology is PESTLE Analysis, which examines the external change drivers and potential hindrances behind a phenomenon from various angles, including political, economic, social, technological, legal, and environmental. This holistic approach provides a well-rounded perspective on whether a change signal holds the potential to grow into a trend.

PESTLE Analysis framework
Often, change signals originating solely from one domain of the PESTLE framework lack the robust foundation needed to evolve into trends. A technology might be promising, but there may not be a social need for it, or there might be major legislative hurdles on the way. But when a diverse set of change drivers align without major barriers, there is a strong likelihood that the phenomenon will gain momentum and evolve into a trend within a foreseeable timeframe.
“When a diverse set of change drivers align without major barriers, there is strong likelihood the phenomenon will gain momentum and evolve into a growing trend.”
Below, we delve into each stage along the S-curve and its key characteristics.

Stages of growth along the S-curve
Weak signal
Weak signals are emerging change signals in their infancy, which are known only among subject matter experts and pioneers. These may encompass new technologies or practices, typically discussed in academic research papers and field-specific journals.
Strong signal
A weak signal transforms into a strong signal when it garners attention from journalists and the public. Strong signals often entail technologies or emerging concepts with significant innovative potential, but they lack practical applications as they are still in the conceptual stage.
Hype cycle
When strong signals gain a lot of interest before the concept materialises, hype cycles often form and inflate expectations. Hype cycles can form due to various factors, such as excessive media coverage, the novelty of the phenomenon, or a corporation generating hype around its new innovation with a substantial marketing budget.
The dot-com bubble of the late 1990s was a prime example of this, as interest and investments in e-commerce surged years before the trend materialized.

Hype cycle and S-curve analysis for big data analysis in EU area
Valley of death
When a hyped strong signal fails to materialise or meet inflated expectations, the hype cycle eventually concludes, and the overinflated market bubble bursts. At this juncture, interest diminishes, and the change signal descends into what is often termed the valley of death.
Following this period, the change signal may take two paths. It may disappear entirely if it was merely a passing fad lacking the underlying driving forces to grow into a trend. Conversely, if the signal possessed trend potential but was hindered by unripe market conditions, it can resurface when the conditions align favorably. For instance, e-commerce stayed in the valley of death for a decade before resurfacing as a prominent trend in the 2010s, when technologies like mobile payments and augmented reality matured.
A more recent example is the metaverse and NFTs, which garnered significant hype during the Covid-19 pandemic and attracted substantial investments. However, interest sharply declined when the novelty wore off and the concepts failed to materialise.

S-curve analysis for e-commerce in EU area
Go to market
Once a change signal materializes into a prototype or proof-of-concept product or service, and early adopters and opinion leaders begin using it and influencing the broader audience, this juncture typically marks the opportune moment to enter the market.
Market break out & trend growth phase
The market experiences a breakthrough when the early majority adopts the trend, sparking rapid and extensive growth. During this initial growth phase, demand outstrips supply, providing opportunities for all suppliers to thrive.
Strengthening trend
Following the market breakthrough, the change signal becomes a strengthening trend, steadily gaining momentum and increasing influence.
Subsequently, as the initial phase of extensive growth subsides, market competition intensifies. This compels suppliers to refine their processes, expand operations, differentiate their offerings, or consider mergers to maintain success in the evolving landscape.
Established trend
Sometimes, the strengthening phase of a trend may pause before it resumes its upward trajectory along the S-curve. During this established phase, trends maintain sustained relevance and growth potential, although they are not actively growing at the moment. While the established phase shares similarities with the valley of death phase, the valley of death occurs before a trend materializes, whereas the temporary established phase occurs within an existing trend.
Market saturation & weakening trend
At a certain point, the trend begins to lose momentum as new trends and change signals emerge to replace it, or it reaches full utilisation, leaving no room for further growth. In both cases, the trend enters its market saturation phase and is deemed a weakening trend, meaning that it no longer has any real relevance.
Access a database of expert analyses on 1000+ change signals and trends

At Futures Platform, our team of in-house futurists continuously scan for emerging change signals and analyse their potential future trajectories using S-curve analysis, alongside other foresight methods.
Book a free demo today to discover how Futures Platform’s digital foresight solution can enhance your foresight work.
Book a demo
RELATED
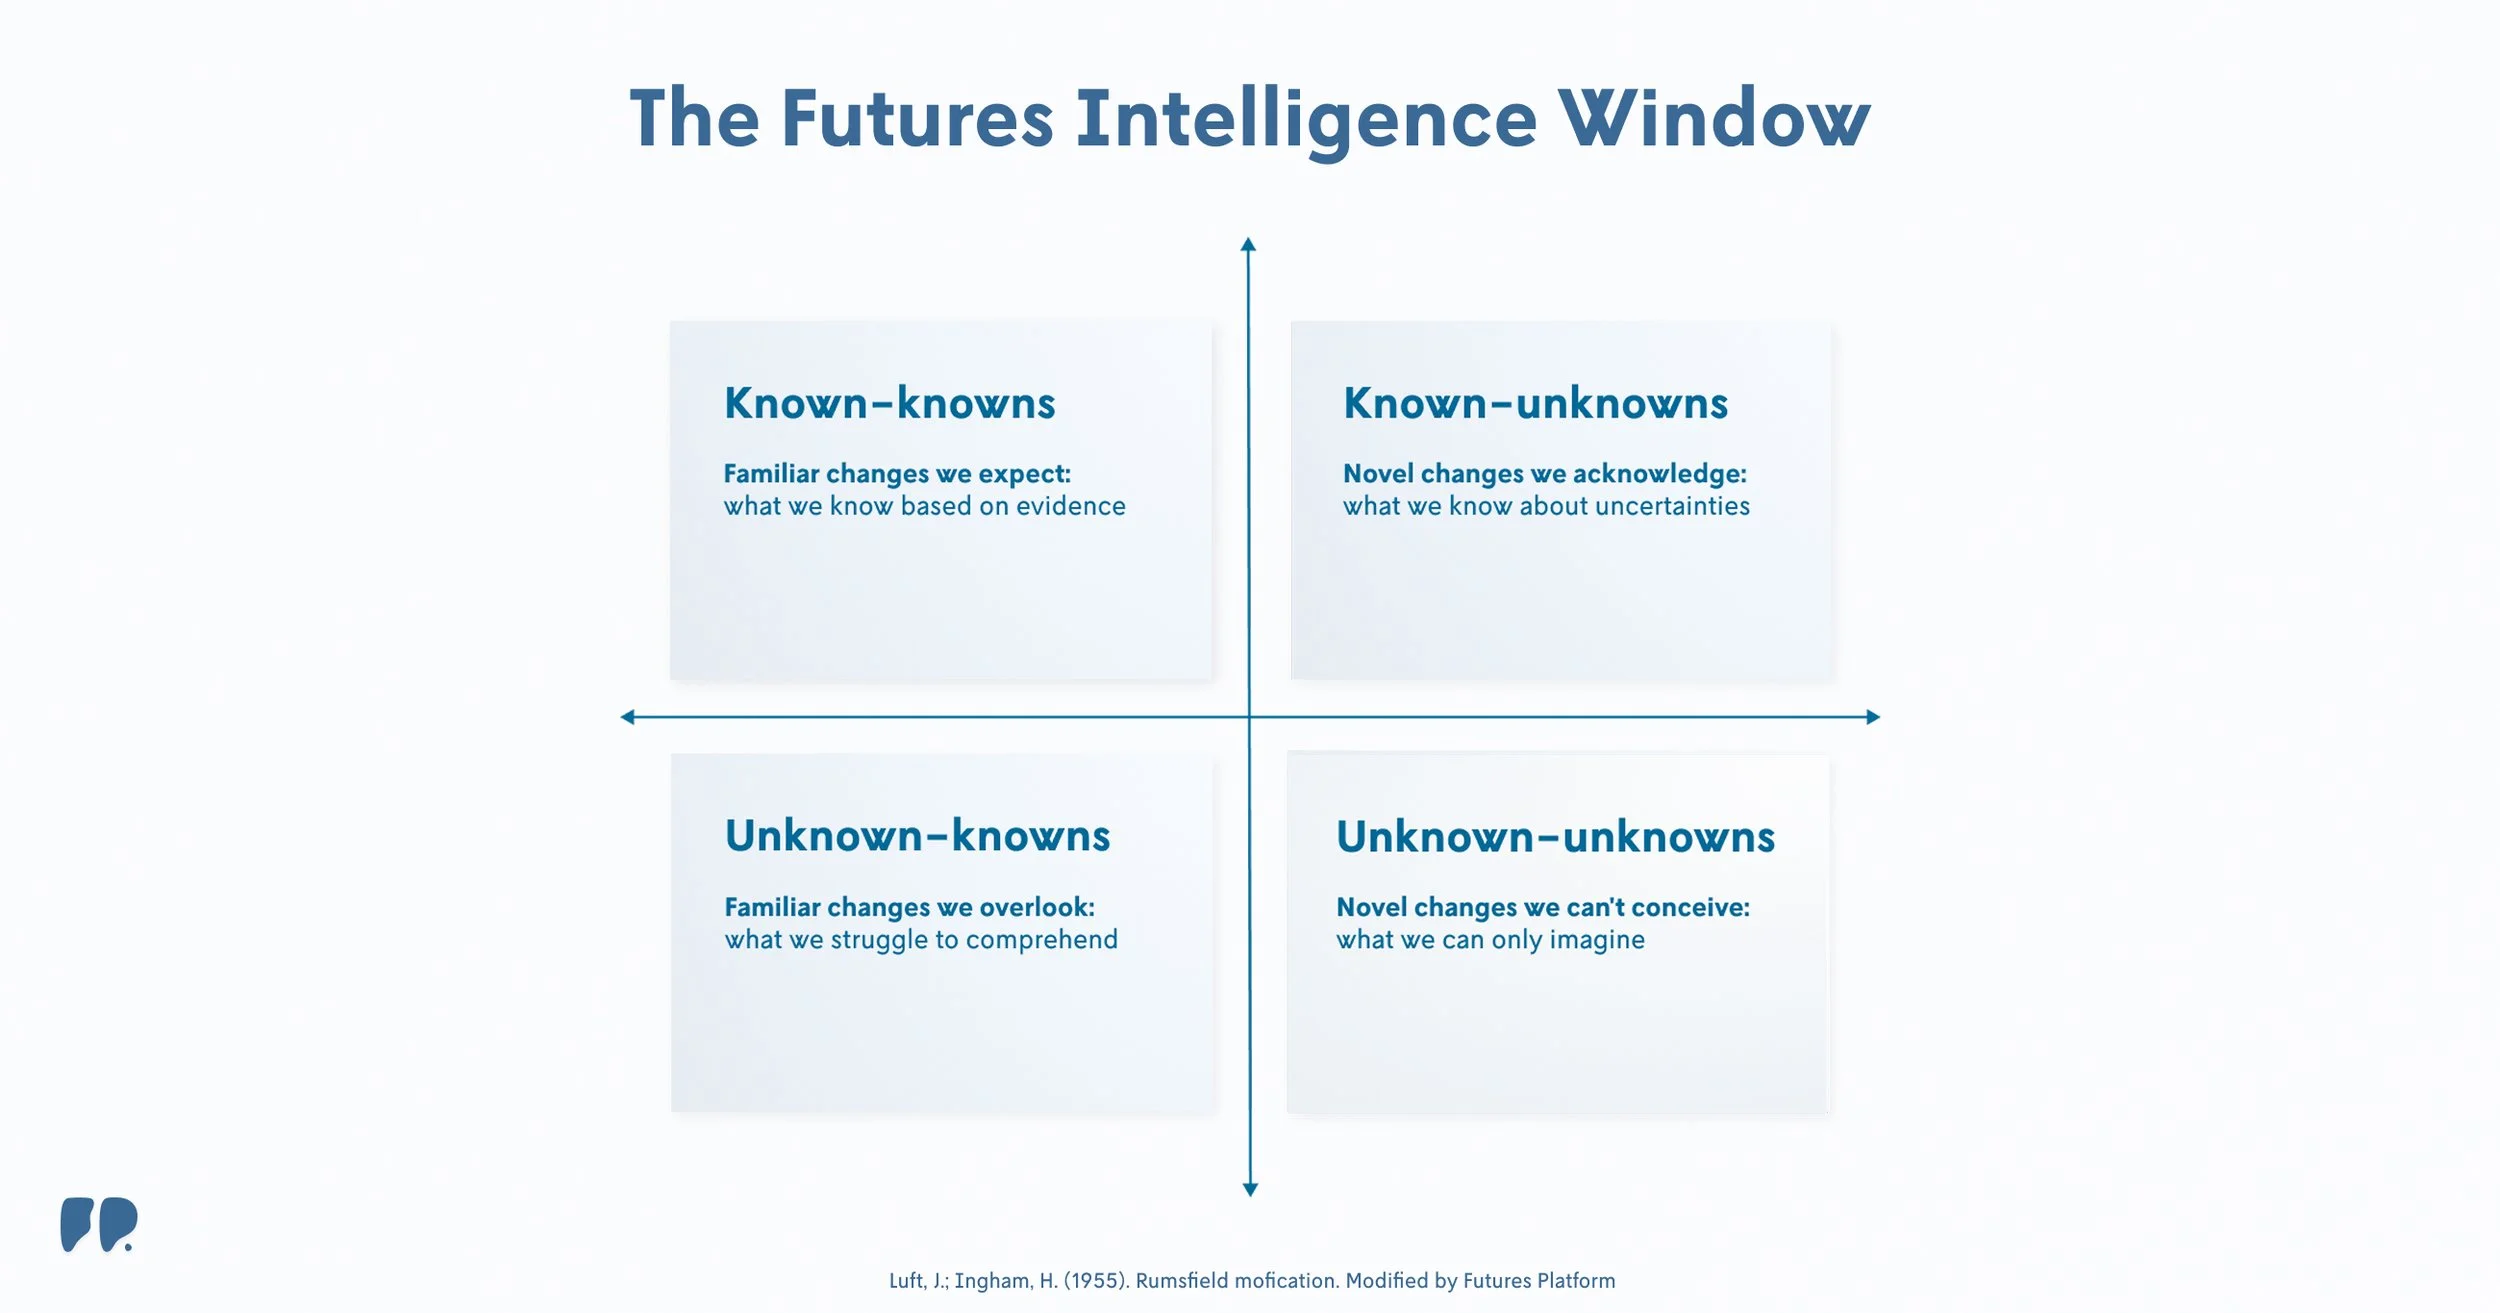


Download futures intelligence guide
Futures Intelligence is an integrative capability that brings different forms of future-related insights in one connected sense-making flow to turn them into shared, decision-ready understanding. It brings together different types of future-focused knowledge. Used in isolation, each has blind spots. Used together, they build a comprehensive picture of the possible futures ahead.